Start wars. Russia as a war initiator
Russia is not among the countries most involved in wars, but it tends to initiate the ones in which it has participated
How belligerent is Russia? If we take into account the last 200 years, could we argue that Russia tends to go to war more than other countries? The datasets of the Correlates of War (COW) project give us a tentative answer to these questions. The COW Project was initiated in 1963 and since then has collected information about war (among other international phenomena, such as trade relations, religious adherence or formal alliances). To answer these questions we are going to use two COW datasets: the State System Membership (v2016) and the Inter-State War Data v4.0.
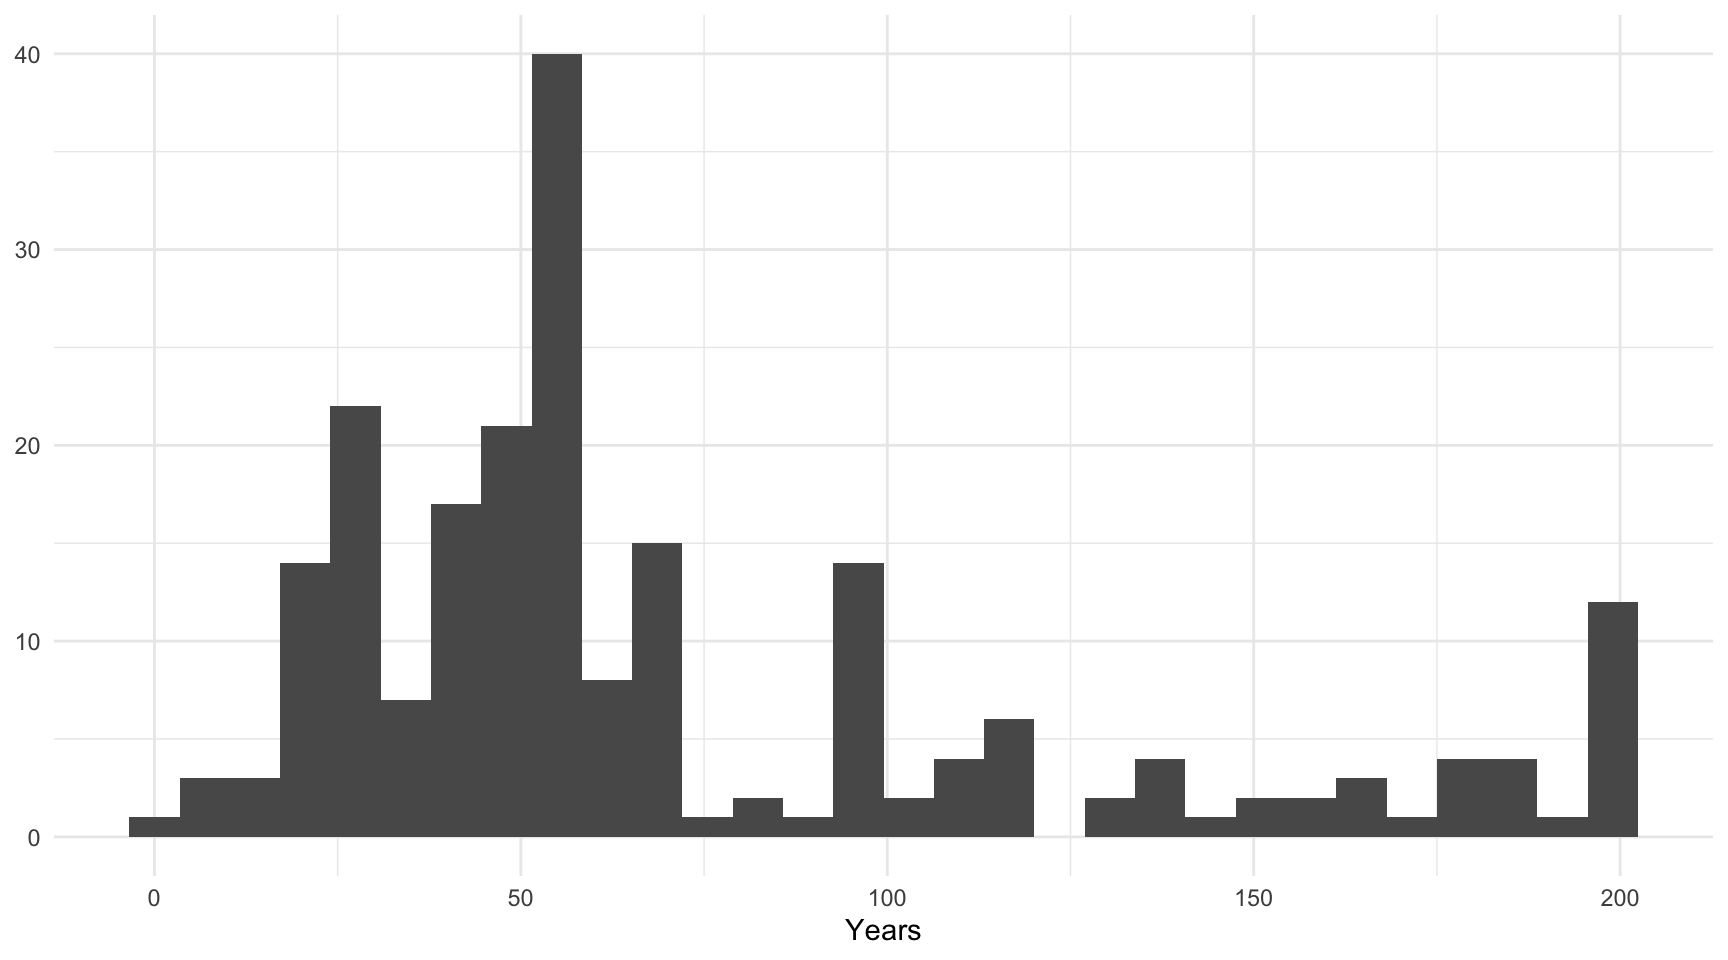
The State System Membership (v2016) records the fluctuating composition of the state system since 1816. Not all states have been present during the last 200 years, so we need to take into account the number of years that every state has got chances to make war to other members of the international system. In Figure 1, we observe that only 12 states have survived the last 200 years. Others have survived less, being the most frequent case to survive about 60 years.

Figure 1: Years of membership in the state system 1816-2016
The second dataset, the Inter-State War Data v4.0, measures the number of wars between states of the international system. From this dataset we have calculated the number of accumulated years every state has been in war. Table 1 shows that France and the United States are the countries that have been more years at war. Russia is located seventh, being at war during 24 years.
| ccode | StateName | WYears |
|---|---|---|
| 220 | France | 39 |
| 2 | United States of America | 36 |
| 640 | Turkey | 30 |
| 200 | United Kingdom | 29 |
| 710 | China | 28 |
| 740 | Japan | 25 |
| 365 | Russia | 24 |
| 816 | Vietnam | 24 |
| 325 | Italy | 21 |
| 900 | Australia | 21 |
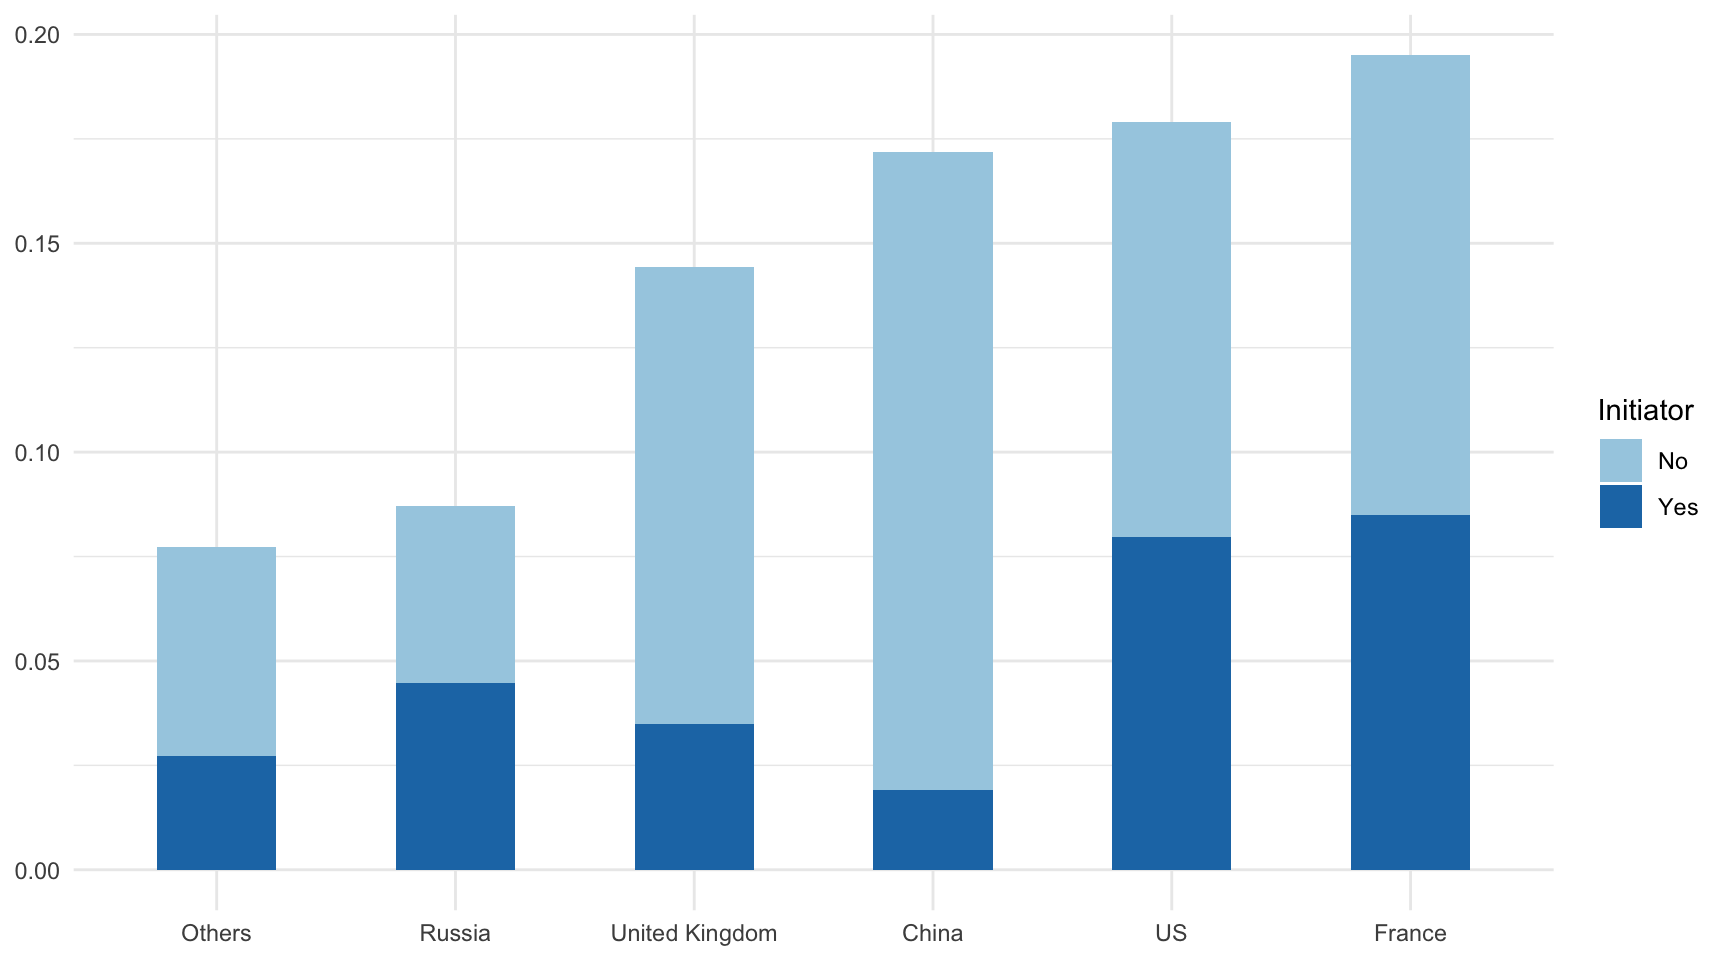
Now we can compare the number of years that each country has being at war, taking into account the number of years of existence for each case. We have selected the permanent members of the United Nations Security Council and created an extra category for the rest of states. Figure 1 shows that France, the United States, and China, in this order, have been at war between the 15-20 percent of its existence. By contrast, Russia has fought wars less than 10 percent of its time.

Figure 2: Percentage of years being at war
But countries may be at war simply because they are being attacked. Another way to view the same data is to look, from all the years that a country has participated in a war, how many of them can be attributed to it as war initiator. This is displayed in Figure 3. In more than half of the years that Russia has been at war, the country can be considered to be the initiator of the conflict. In other countries, the proportion is lower.

Figure 3: Years being at war as initiator of the conflict
The idea of this post has been taken from Paul Poast, which follows a different (and probably much better) approach:
Teaching statistics is tough right now, with students (and 🙋♂️) more concerned about the events unfolding in Ukraine. But in yesterday's class on comparing regression coefficients, I used inter-state war data to offer a highly relevant lesson 👇 pic.twitter.com/IOvnBUPnBE
— Paul Poast (@ProfPaulPoast) March 4, 2022